Data monitoring
Monitoring table
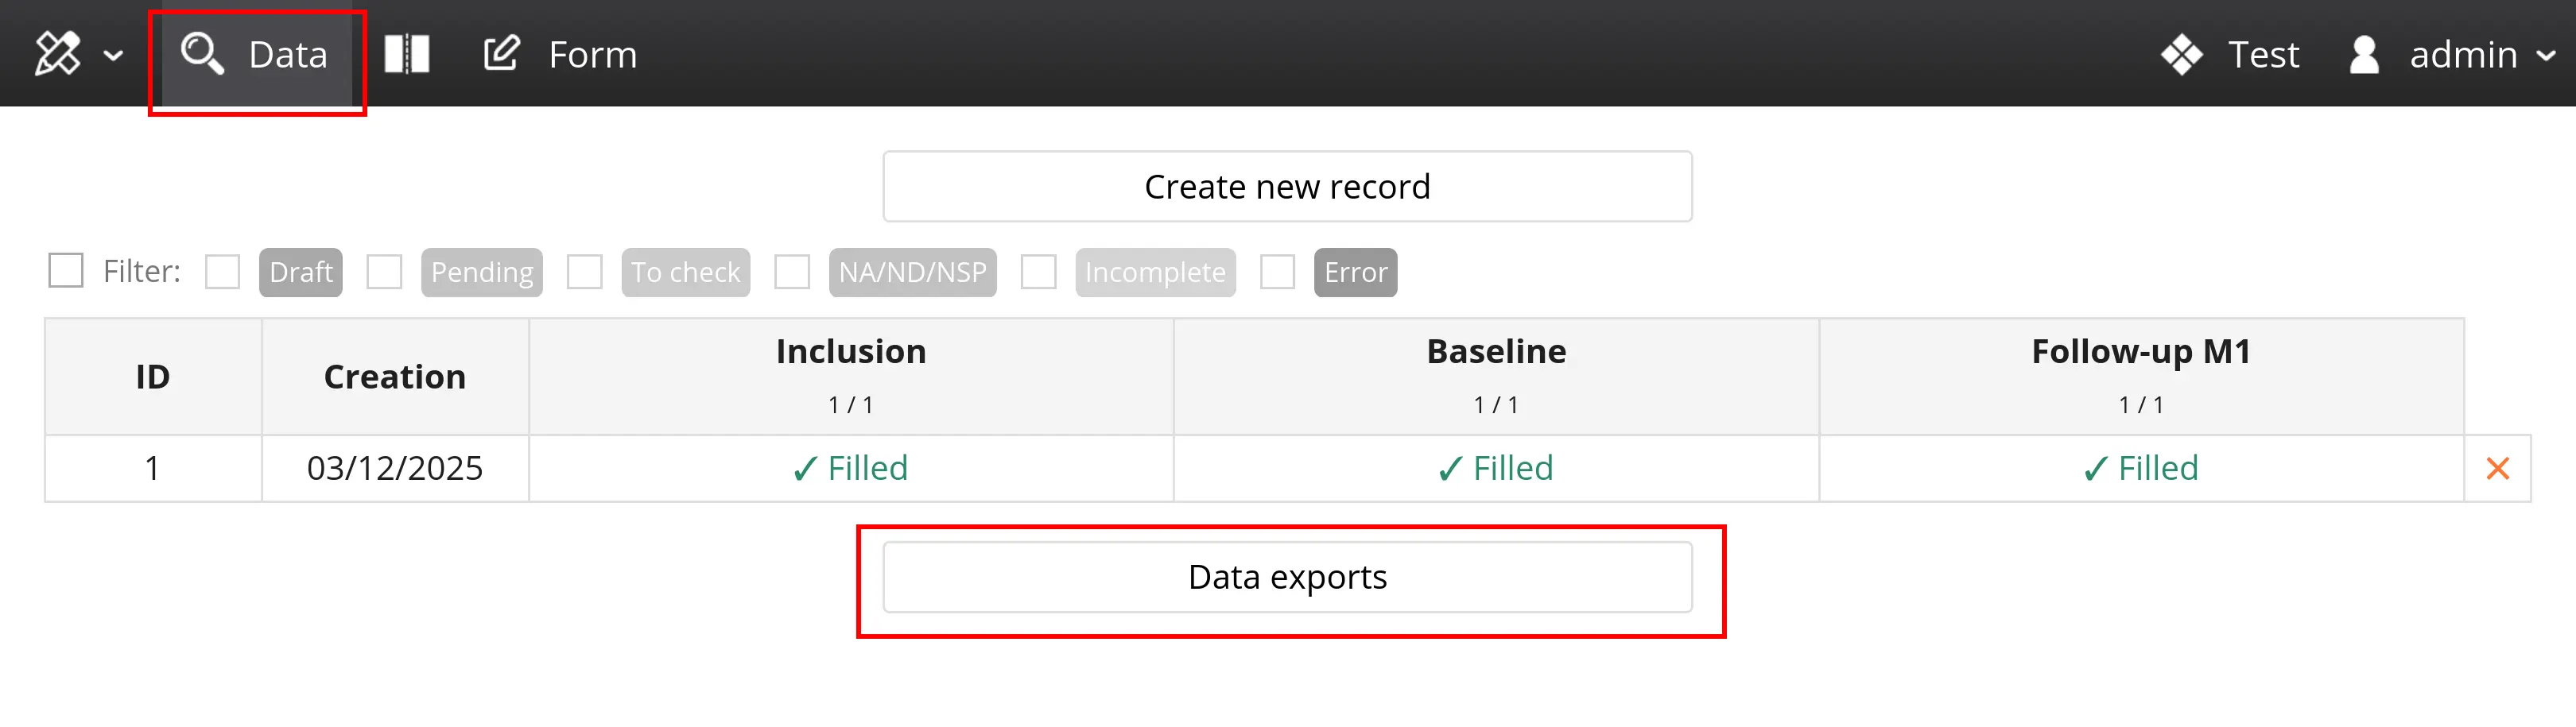
Each record feeds the data monitoring table, accessible via the data panel (highlighted in red below). This table is displayed by default when you log in to a Goupile project.
The monitoring table shows one row per record, along with the following columns:
- A specific HID identifier for each record
- The creation date of the record
- One column per page, showing its completion status and possibly the summary (if it exists)
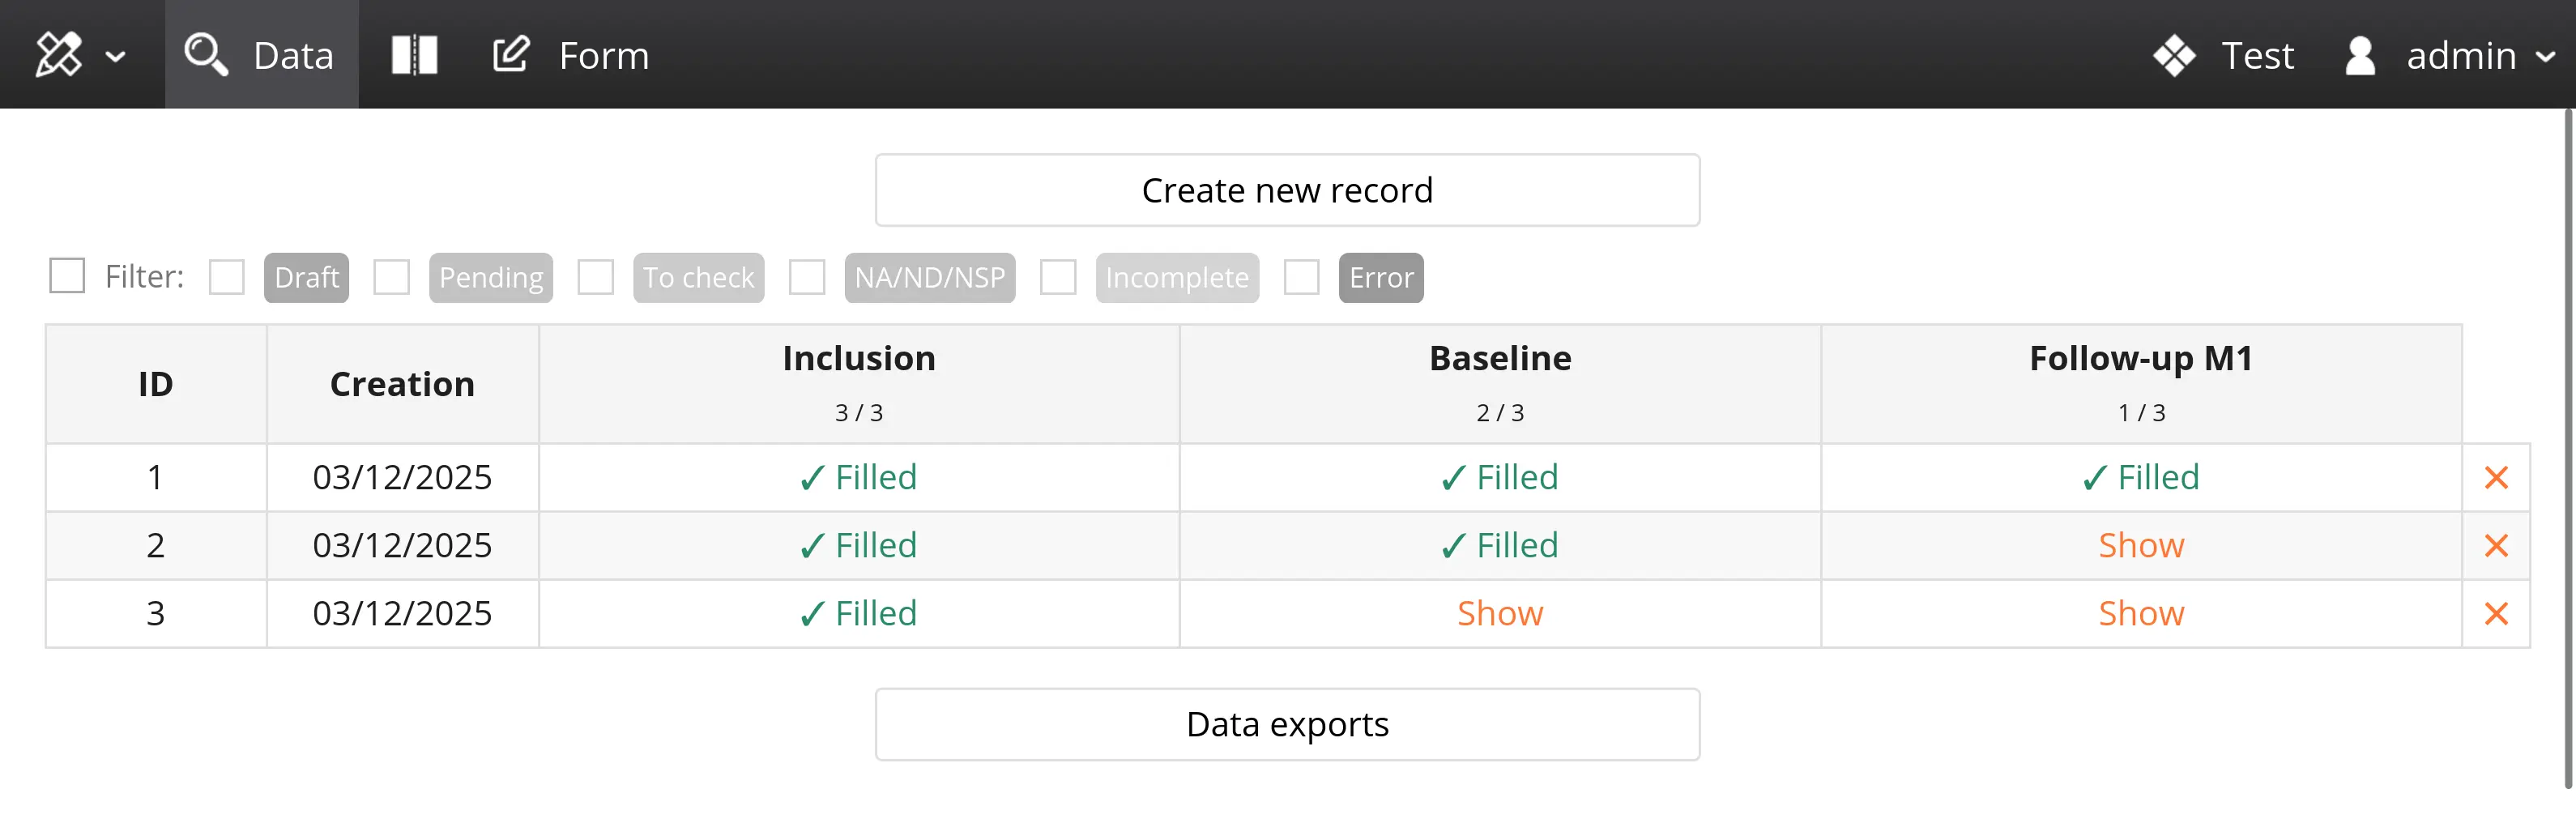
Above the table are various filters related to annotations, detailed later.
Export buttons are located below the table. They are visible only to users with the appropriate permissions.
Data filters
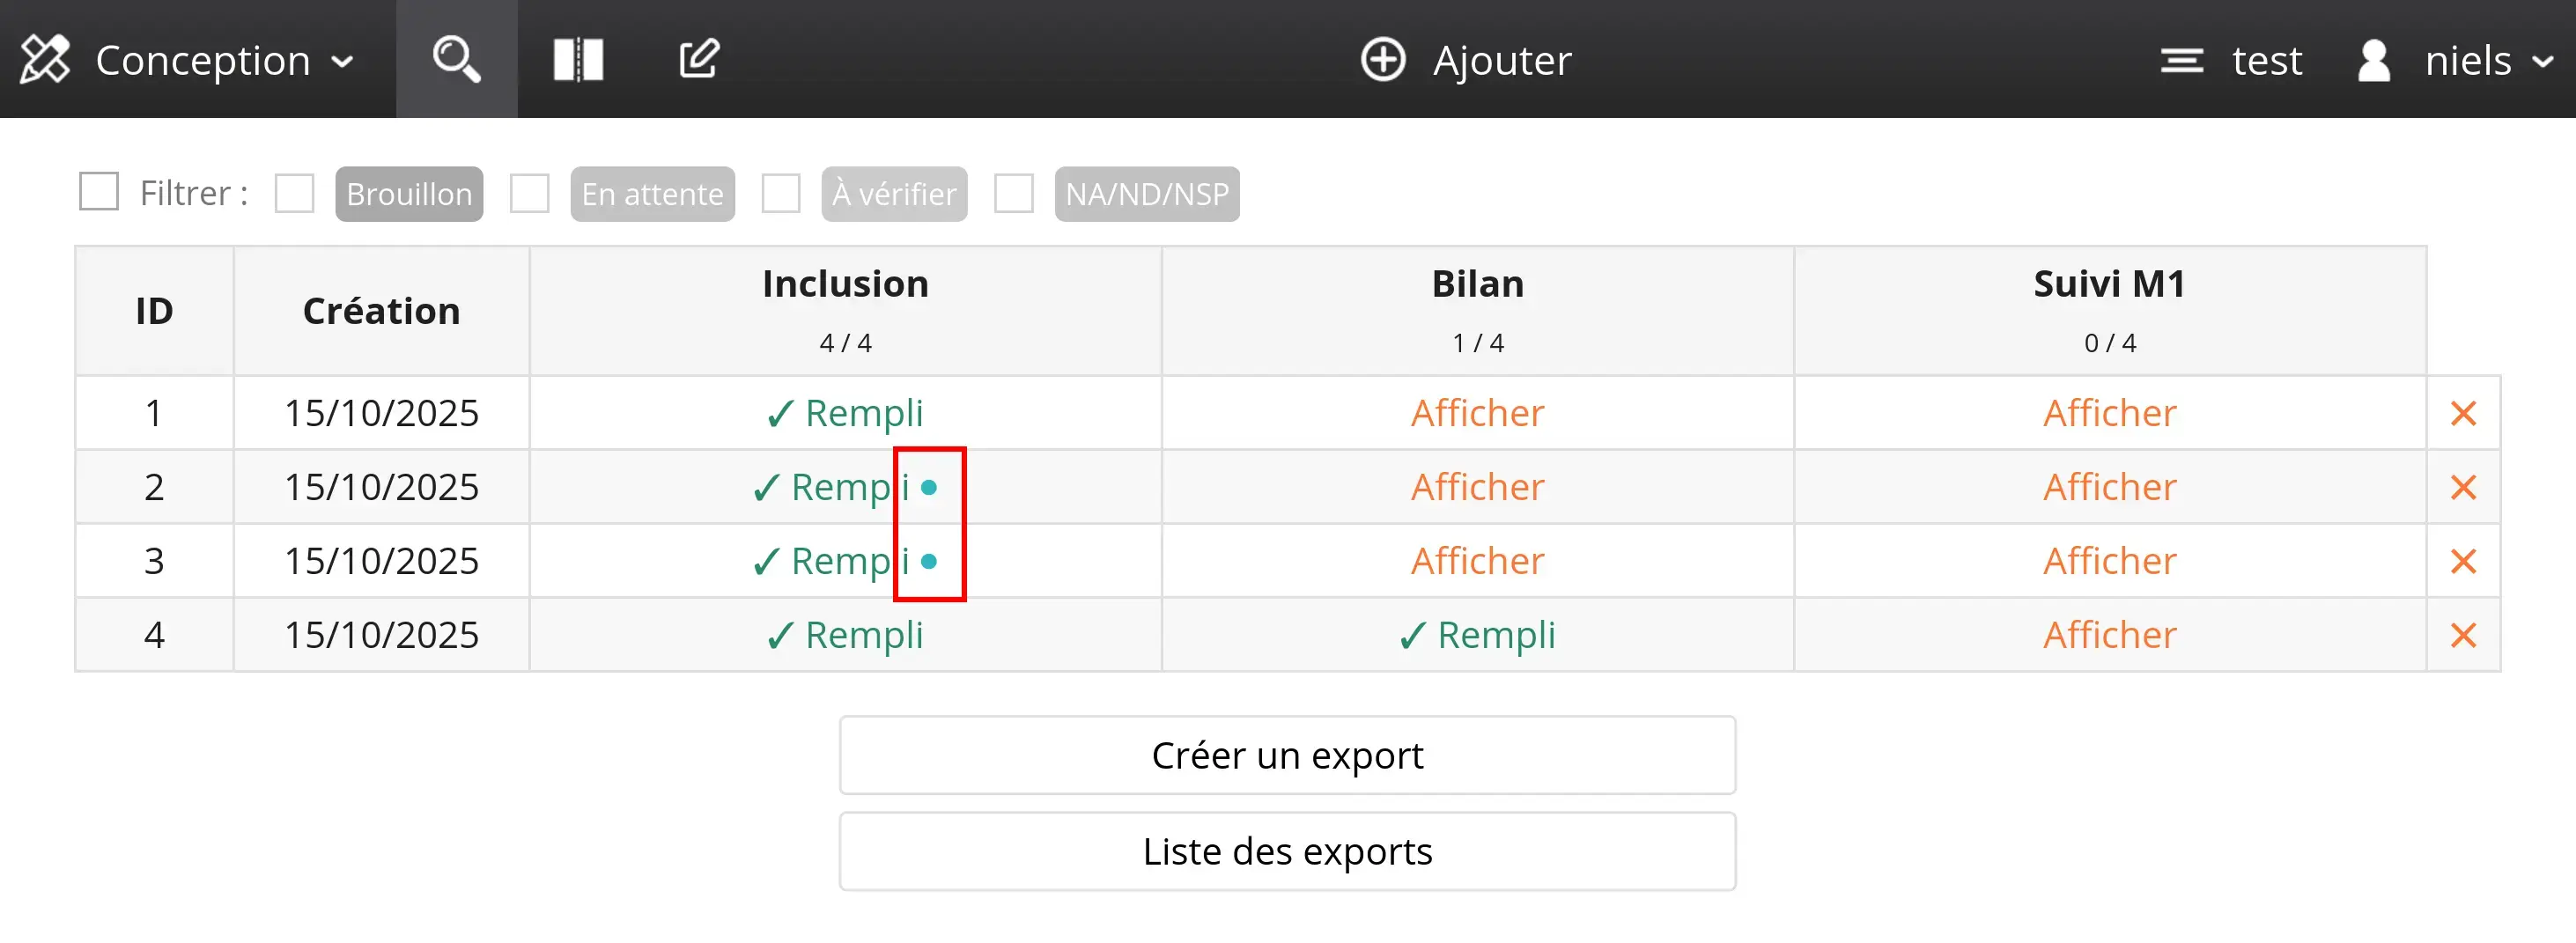
When a variable is annotated with a status, the record inherits the statuses of all the variables it contains. In the monitoring table, statuses are displayed as small colored dots next to the record and the corresponding page.
The screenshot below shows two records (ID 2 and 3) with the status "To be verified":
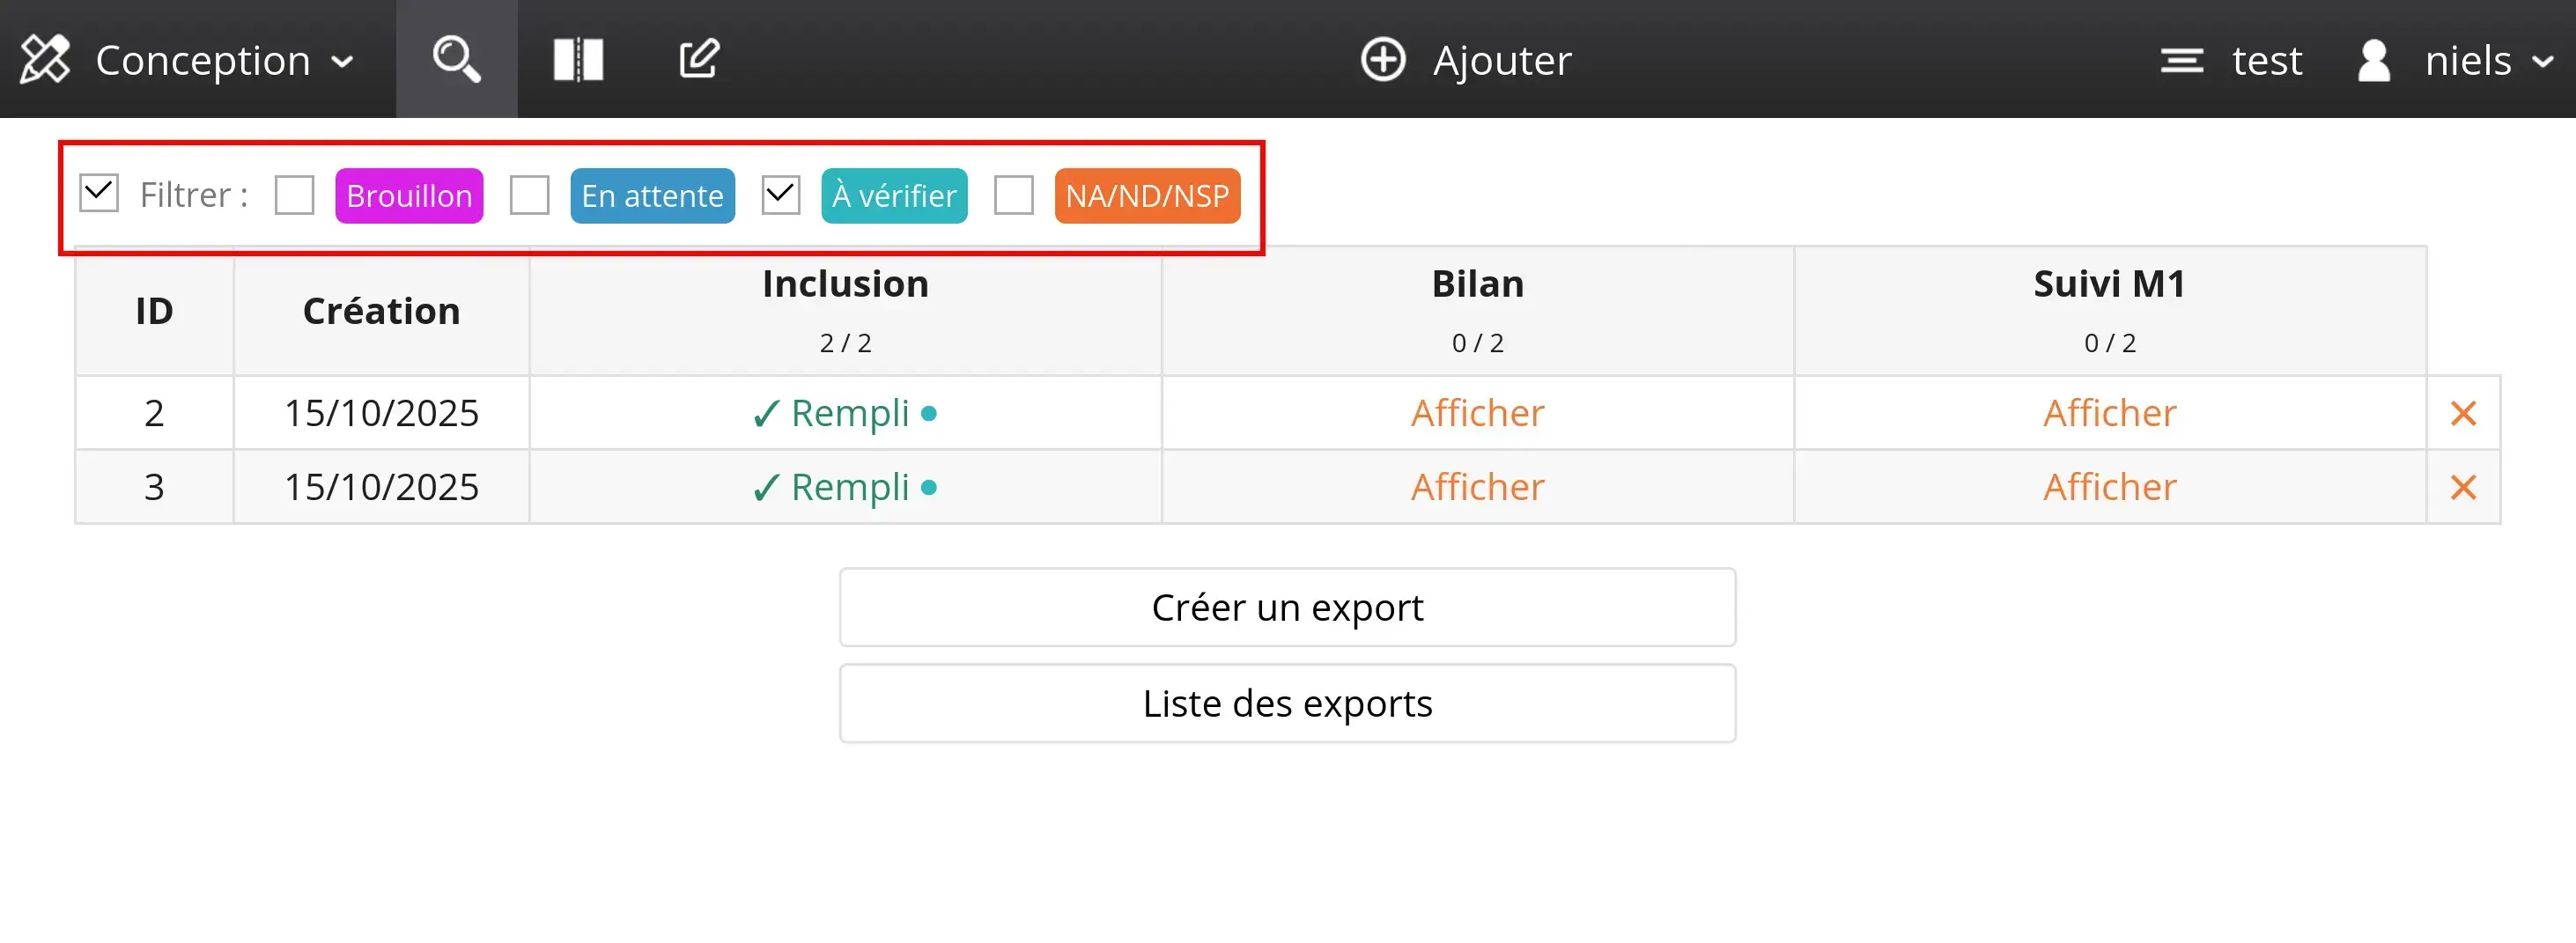
Use the "Filter" menu above the table to display only the records with pages matching one or more specific statuses.
In the screenshot above, only records with the "To be verified" status are displayed:
Data exports
Collected data can be exported to an XLSX file that you can open in your spreadsheet or load into an analysis tool (such as R).
You can create exports manually (see below) or configure automated exports in Goupile's administration module.
Creating an export
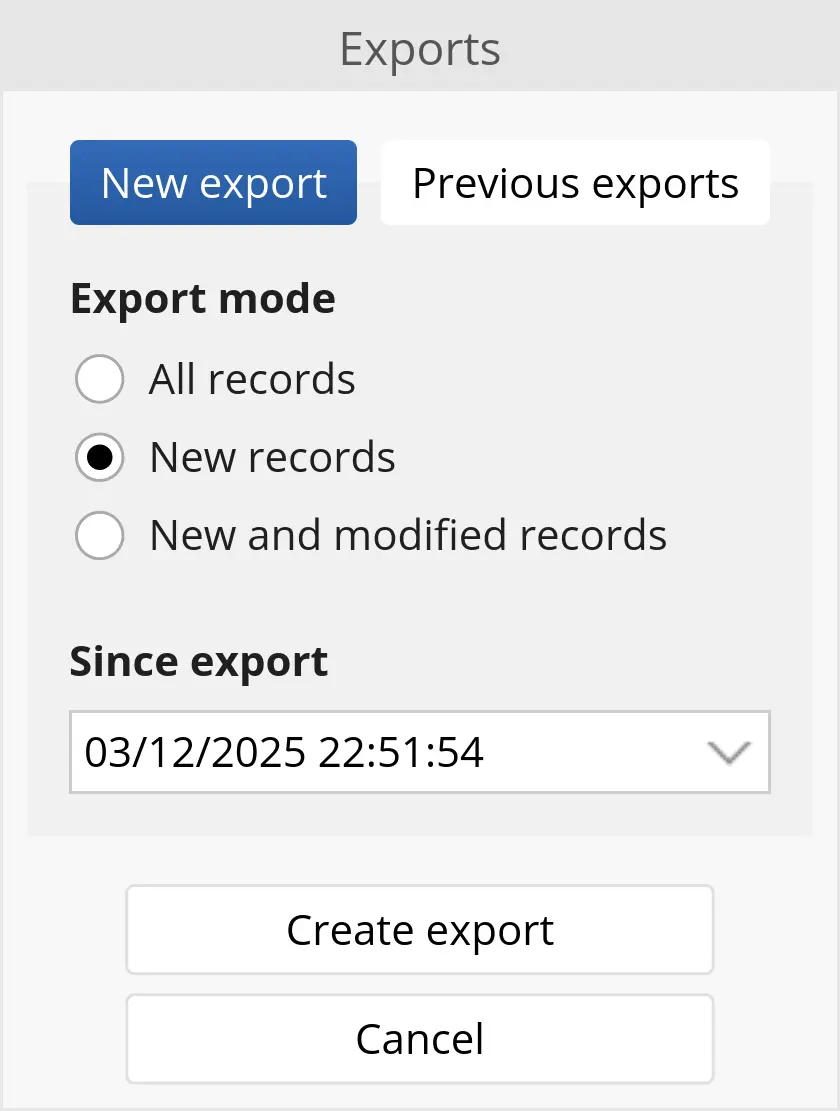
Use the "Create export" button below the monitoring table to export data in XLSX format.
You can export either:
- All records (default choice)
- Records created since the last export
- Records created or modified since the last export
There are two permissions related to exports: the permission to create an export (ExportCreate), and the permission to download an export (ExportDownload).
These rights make it possible to create a user who can download existing exports without being able to create new ones.
Data format
Each page is exported to a separate sheet in the XLSX file, with the name corresponding to the page key.
Pages for which no record is filled in are not exported.
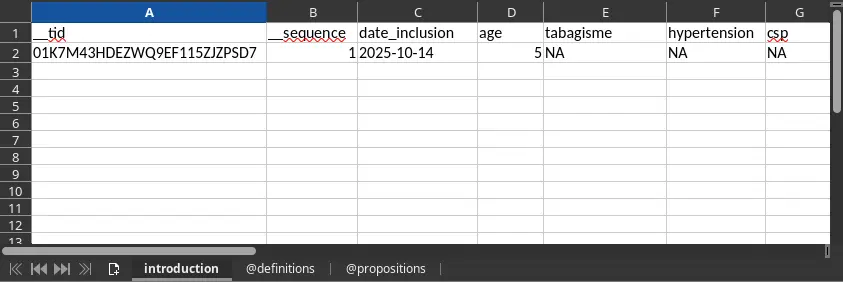
The columns in each sheet are organized as follows:
- Column
__tid: TID identifier of the record - Column
__sequence: sequence identifier of the record - Column
__hid: HID identifier of the record - One column per variable, named after the variable key, except for multiple-choice questions which are exported into several columns (one option per column named
variable.option)
When a page is not filled in for a record, no row is present in the corresponding sheet of the exported file. This means that the different pages corresponding to a given record will appear on different rows in each sheet.
You must therefore use a join based on the __tid column to merge data from different sheets!
Variable dictionary
The exported file also includes two sheets related to the variable dictionary:
- @definitions: list of variables with their label and corresponding type
- @propositions: list of response propositions for single-choice and multiple-choice variables
List of variables
The @definitions sheet includes four columns: the first indicates the table (or page) concerned, the second the variable name, followed by the user-facing label, and finally the data type.
In the example table below, two variables are defined: an age variable of type numeric (number), and a single-choice (enum) variable related to smoking.
| table | variable | label | type |
|---|---|---|---|
| introduction | age | Age | number |
| introduction | smoking | Smoking | enum |
Response propositions
The @propositions sheet lists the possible choices for all single-choice (enum) or multiple-choice (multi) variables found in the recorded data.
In the example table below, the variable smoking has 3 response options: active, stopped, and no.
| table | variable | prop | label |
|---|---|---|---|
| introduction | smoking | active | Active smoker |
| introduction | smoking | stopped | Former smoker |
| introduction | smoking | no | Non-smoker |